No matter what major you have selected, with a high probability you will be taking statistics classes. Some research papers and theses require SPSS Statistics software for the research. This tool is especially helpful for handling large and complex data. With this software you can easily describe data, observe relationships between variables, and compare data sets. If statistics classes are not your cup of tea, don’t worry! On our blog we have collected several samples that will help you learn SPSS Statistics basic functions. You can also ask for do my statistics homework for me assistance any of our statistics experts.
In the following regression statistics example you will learn how to do correlation and linear regression. Also, you will find out how to find the relationship between average income and total expenditure using SPSS Statistics. We have included in the regression statistics example a detailed description of steps illustrated with screenshots that should help you clearly understand the information. Check the text below and you will find out that you can easily use this method in your own research.
Correlation and Linear Regression is SPSS Statistics
Task: take a closer look at how to do correlation and linear regression is SPSS Statistics.
Example 1
Is there any relationship between the total expenditure and average income?
Beginning salary and current salary are quantitative variables, so the relationship between them is a correlation, thus the correlation coefficient should be calculated. From the menus, choose Analyze / Correlate / Bivariate. For quantitative, normally distributed variables, choose the Pearson correlation coefficient. If the data are not normally distributed or have ordered categories, choose Kendall’s tau-b or Spearman, which measure the relationship between rank orders.
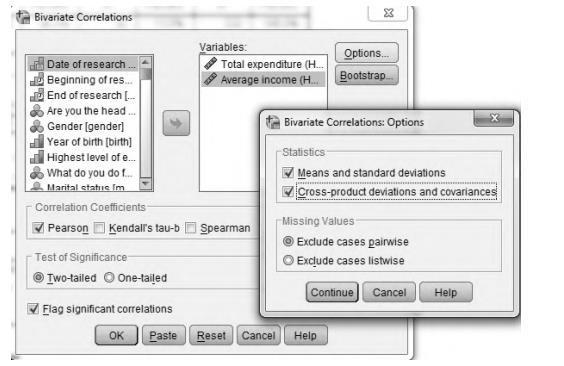
Optionally, covariance can be displayed by clicking on Options. Covariance is an unstandardized measure of the relationship between two variables, equal to the cross-product deviation divided by n-1. It shows the direction of a relationship (positive or negative relationship).
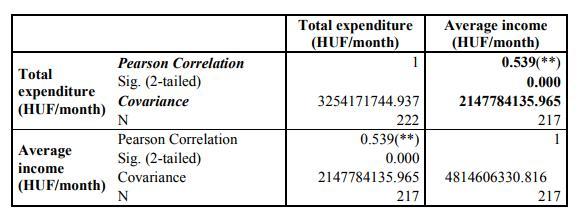
There is a positive, medium-strong and significant (Sig.=0.000) relationship between the average expenditure and income.
Example 2
Determine a linear relation between the average monthly income and total expenditure.
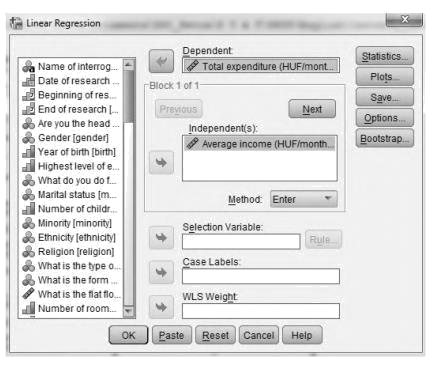
Linear regression estimates the coefficients of the linear equation, involving an independent variable, that best predict the value of the dependent variable. Which variable has an influence on the other one: the average monthly income or the total expenditure? The average monthly income can have an influence on the total expenditure, thus the dependent variable is the total expenditure and the independent variable is the average monthly income. To obtain a linear regression analysis, from the menus choose Analyze / Regression / Linear.
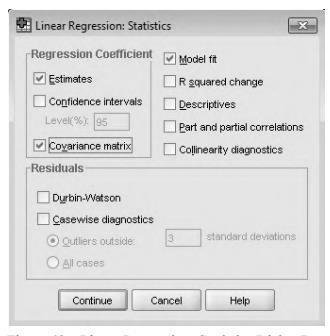
Optionally, we can display the covariance matrix and the matrix for correlation coefficients (again) by clicking on Statistics, as it is shown on the figure below.
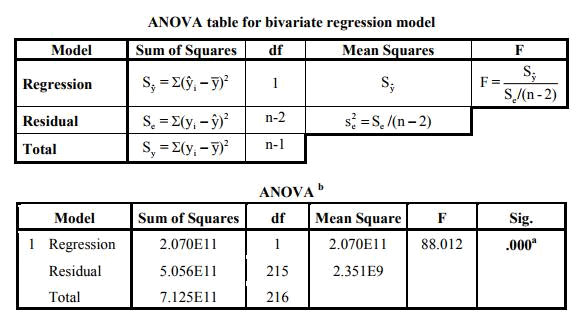
The ANOVA table is used for testing the significance of the overall regression. If the significance level is close to zero (lower than 0.05), the regression is significant.
For analyzing the coefficients of linear regression, take a look at the table below.
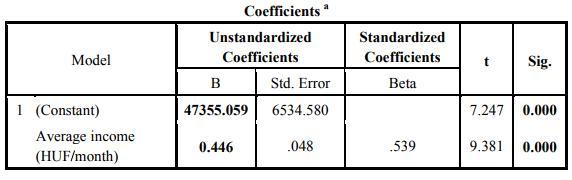 The constant is the intercept point, when x=0. In general, it does not have a meaning, so we do not interpret the constant. However, it would be the average total expenditure (47355.059 HUF) in the case of zero average income. The b1 coefficient tells you how much the dependent variable is expected to increase (if the coefficient is positive) or decrease (if the coefficient is negative) when that independent variable increases by one. Therefore, when the average income increases by 1 HUF, the total expenditure is expected to increase by 0.446 HUF. Moreover, it is good to interpret the results of t-test, which test the significance of the parameters. A lower p-value than 0.05 (5%) is the generally accepted amount to reject the null hypothesis of using non-significant values.