As an example of the cumulative distribution, we will build and analyze the cumulative frequency distribution for rolling two standard number cubes.
Analysis:
If we sum all possible combinations from two standard cubes, we will get the following values:
| N/N | 1 | 2 | 3 | 4 | 5 | 6 |
|---|---|---|---|---|---|---|
| 1 | 2 | 3 | 4 | 5 | 6 | 7 |
| 2 | 3 | 4 | 5 | 6 | 7 | 8 |
| 3 | 4 | 5 | 6 | 7 | 8 | 9 |
| 4 | 5 | 6 | 7 | 8 | 9 | 10 |
| 5 | 6 | 7 | 8 | 9 | 10 | 11 |
| 6 | 7 | 8 | 9 | 10 | 11 | 12 |
Each value has its frequency and probability, see table below:
| Value | Frequency | Cumulative frequency | Probability |
|---|---|---|---|
| ⩽ 2 | 1 | 1 | 1/36 |
| ⩽ 3 | 2 | 2+1=3 | 2/36 |
| ⩽ 4 | 3 | 3+3=6 | 3/36 |
| ⩽ 5 | 4 | 6+4=10 | 4/36 |
| ⩽ 6 | 5 | 10+5=15 | 5/36 |
| ⩽ 7 | 6 | 15+6=21 | 6/36 |
| ⩽ 8 | 5 | 21+5=26 | 5/36 |
| ⩽ 9 | 4 | 26+4=30 | 4/36 |
| ⩽ 10 | 3 | 30+3=33 | 3/36 |
| ⩽ 11 | 2 | 33+2=35 | 2/36 |
| ⩽ 12 | 1 | 35+1=36 | 1/36 |
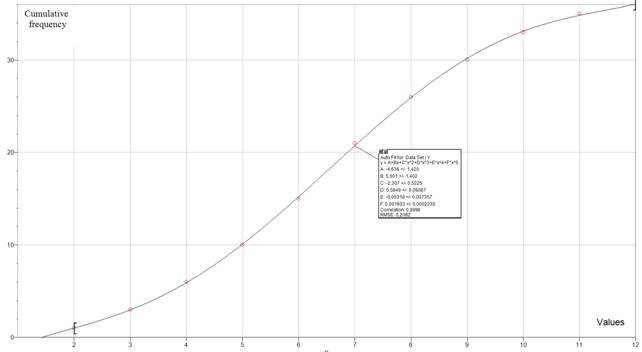
The cumulative frequency graph can be built according to the values in the table:
Position of the median:
![]()
The Median:
![]() – from the graph, round to the nearest integer as for discrete structure
– from the graph, round to the nearest integer as for discrete structure
Position of the lower quartile:
![]()
Lower quartile:
![]() – from the graph, round to the nearest integer as for discrete structure
– from the graph, round to the nearest integer as for discrete structure
Position of the upper quartile:
![]()
Upper quartile:
![]() – from the graph, round to the nearest integer as for discrete structure
– from the graph, round to the nearest integer as for discrete structure
Interquartile range:
![]()
This tells us that the difference between maximal and minimal value in the middle 50% is equal 4.
References
Liu, Stanley T. Experimental And Analytical Investigation Of Solar Radiant Flux Distribution On Interior Surfaces Of A Sunspace. Gaithersburg, MD: U.S. Dept. of Commerce, National Bureau of Standards, 1986. Print.
Salkind, Neil J. Encyclopedia Of Research Design. Thousand Oaks, Calif.: Sage, 2010. Print.
IT Assignments Assistance from the Top Experts
The presented cumulative frequency distribution table sample was completed by one of AssignmentShark IT experts. If you found the presented sample useful, you may also like the grouped frequency distribution table example.
If you still don’t understand how to complete an assignment of similar kind, or are assigned a different project, you can count on us. We will help with technical assignments of any difficulty level and will will follow all of your requirements. If you need free accounting homework help online, you can check the available samples on our blog, or ask our experts to help you with your task for money.