Suppose that as a result of some experiment, a sample x1, x2, x3 … xn has been obtained.
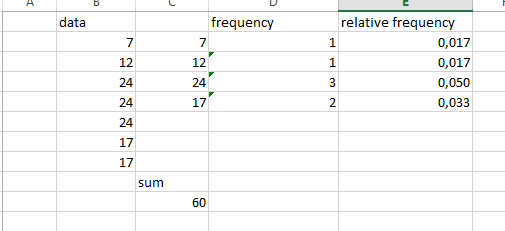
We have a data retrieval: 7, 12, 24, 24, 24, 17. 17. Let’s find the relative frequency distribution using Microsoft Excel:
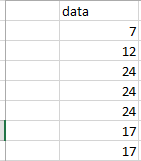
- Input the original data into the table:

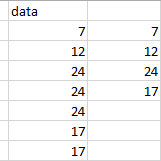
- Create an array of values in which we will put a data array for which we calculate frequencies (7, 12, 24, 17):

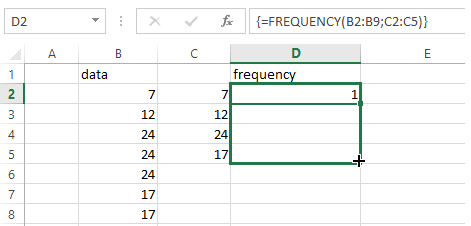
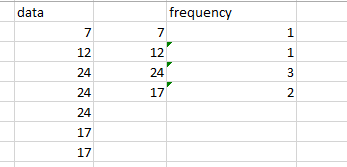
- Calculate the frequencies using the statistical function FREQUENCY, so we get statistical distribution of the data retrieval (to record the array of frequencies to the table, it is necessary to allocate a certain number of cells, and after the call of the function FREQUENCY press F2, and then Ctrl + Shift + Enter):


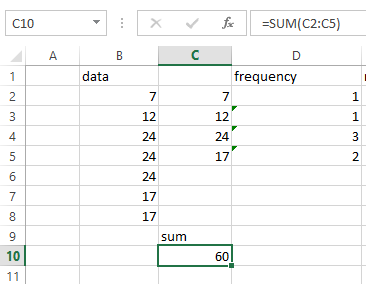
- Calculate the sum of the frequencies using the SUM function:

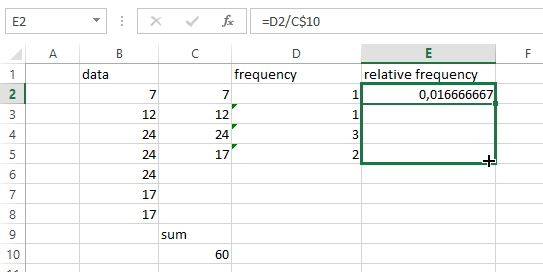
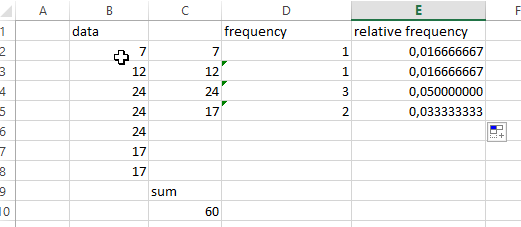
- Calculate the relative frequency distribution: divide each frequency by the sum of the frequencies (it’s useful to put the dollar sign between the letter and the number of the sum cell because it will be easy to multiply it):


- Format the cells to make them more comfortable to read:

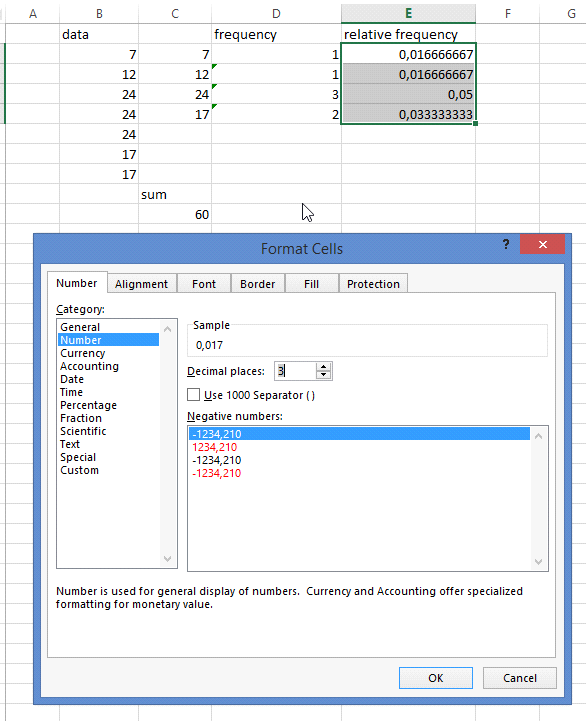
Now it’s much more understandable:
So with the help of such a simple manipulations we got the relative frequency distribution. Thanks for your attention. If you still don’t know how to construct a relative frequency distribution, ask our experts for online assignment help you. We work 24/7 to meet your deadlines and provide qualified help.
You can also like cumulative frequency distribution table sample completed by one of our experts.