Question #1
The dependence between cutting speed and spindle speed during turning of the metal shaft is given in the table below. The diameter of the shaft is 40 mm. Using MATLAB, input this data as vectors and plot it. Use the insert icon to label the axes and add a title to your graph. Turn in the graph.
Table 1. Spindle speed vs. cutting speed.

Solving
Step 1. In MatLab Command Window, enter the data for cutting speed,  as a vector in the form: >=[30 40 50 100 150 200] (see Figure 1 below).
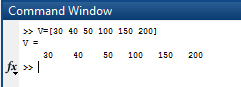
Figure 1.
Step 2. In MatLab Command Window, enter the data for spindle speed, n as a vector in the form: > n=[239 318 398 795 1194 1591] (see Figure 2 below).
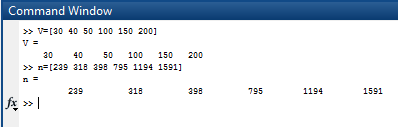
Figure 2.
Step 3. In order to plot the graph of these two vectors in MatLab Command Window, enter: >plot(V,n) (see Figure 3 below).
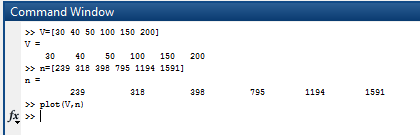
Figure 3
Step 4. After accomplishing Step 3, a graph will appear in a new window, as shown in Figure 4 below. In order to add the Title and X and Y labels, go to: Insert>X Lable/Y Lable/Title.
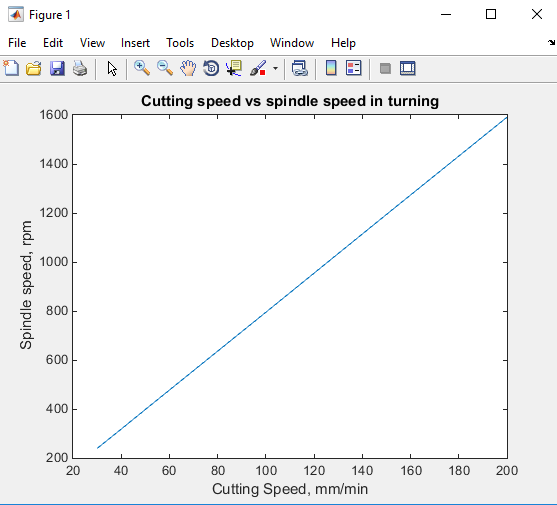
Figure 4
Question #2
Make an inline function g(x)=x+sin( ). Plot it using vectors x=-5:.5:5; and y=g(x);.
Solving
Step 1. In Command Window, enter the inline function as follows: > g = inline(‘x+sin(x.^4)’,’x’) (see Figure 1 below).
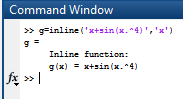
Figure 1
Step 2. Enter the vector x in form of x=-5:.5:5; and y=g(x);. See figure 2 below.
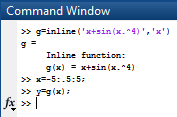
Figure 2
Step 3. In order to plot the function g(x) in the Command Window, enter: >plot(x;y) (see result in the Figure 3 below).
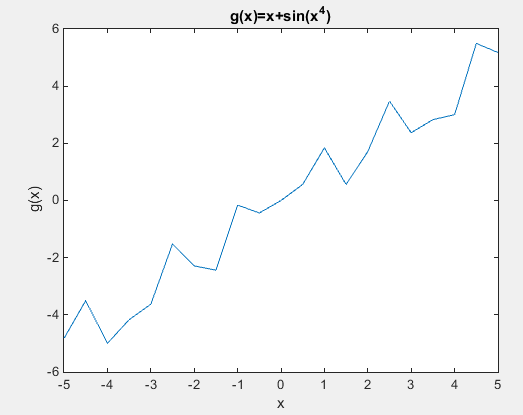
Figure 3
In order to make the plot more precise, the step of the x vector should be reduced. Enter: >x=-5:.01:5;. See result in Figure 4 below:
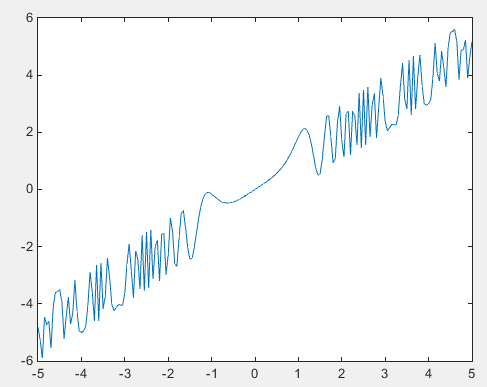
Figure 4
Question #3
Write a function program for the function 
 . Plot the function on [-5,5].
Solving
Step 1. In a new document window of MatLab, type the function as shown in Figure 1 below:
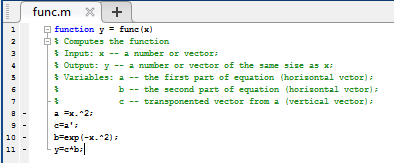
Figure 1
Step 2. Save the function as “func.”
Step 3. In the Command Window, enter the x vector as follows: > x=-5:.1:5; after this, enter the function as follows: y=func(x);.
Step 4. Plot the function in the graph. Enter: plot(x,y) and the result would be as shown in Figure 2 below:
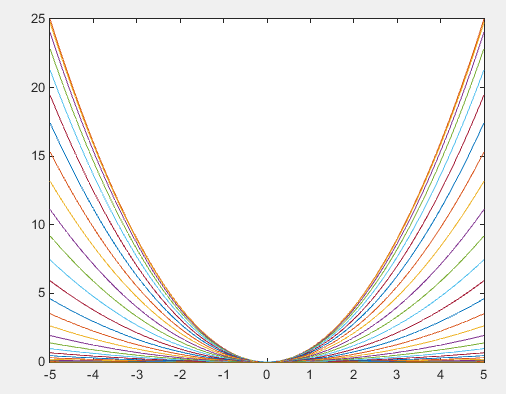
Figure 2
Question #4
Write a script program in MatLab that graphs the functions sin x, sin 2x, sin 3x, sin 4x, sin 5x, and sin 6x on the interval [0,2π] on one plot.
Solving
Step 1. In a new document of MatLab, enter the script text as shown in the picture below:
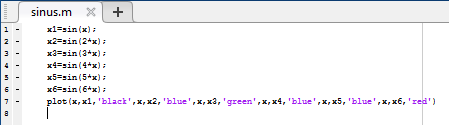
Figure 1
Step 2. Save the script.
Step 3. In the Command Window, enter the vector x as follows: >> x=linspace(0,2*pi,40); and after this, enter the name of the script, for instance: >>sinus. Result should look like Figure 2 below.
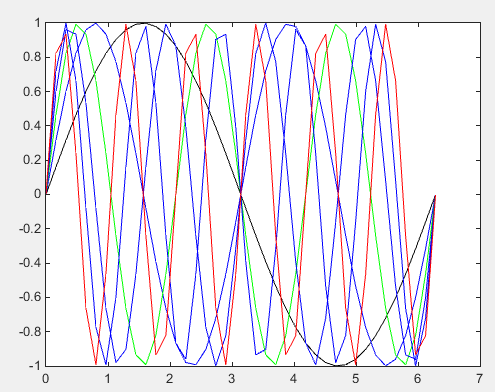
Figure 2
MATLAB Homework Assistance from AssignmentShark
You can also read Naive Bayes spam filter example posted on our site to help IT students succeed in their studies.
The sample of assignment on MATLAB you’ve recently looked through was accomplished by one of our IT experts. If you need MATLAB homework help with similar projects and feel difficulties while completing technical assignments, don’t hesitate to contact AssignmentShark.com and get professional advice, and help with MATLAB homework.