Naive Bayes classifier
Naive Bayes classifier is one of the easiest classification algorithms. However, very often it works even better than the more complex algorithms. I want to share the C# code and a description of how it all works.
And so, for example, I will take the problem of determining the type of the vehicle using it’s dimensions. Of course, to determine the type, you can create a large list of vehicles. But this list, in any case will never be comprehensive. In order to solve this problem, you can “train” a model for the marked name.
Theory
Assume we have a text line O. Furthermore, the are classes C and to one of them we refer string. We need to find such a class C wherein its probability be maximal for a given text line. Mathematically it looks like this:
![]()
It’s difficult to calculate ![]() . But we can use Bayes’ theorem and go to
. But we can use Bayes’ theorem and go to
![]()
indirect probabilities: Since we are looking for a maximum of a function, the denominator doesn’t interest us (it is constant in this case). In addition, it is necessary to look at a line O. Normally, it makes no sense to work with the entire line. It is much more effective than isolated from its certain features. Thus, the formula becomes:
![]()
![]()
![]()
Now we turn on the “naive” assumption that the variables O depends only on class C, and don’t dependent on each other. This is a highly simplified, but it works. The numerator becomes: The final formula will be: So all we need to do is to calculate the probability ![]() , and
, and ![]() . The calculation of these parameters is called the training of the classifier.
. The calculation of these parameters is called the training of the classifier.
I have attached the C# project that implements the mentioned algorithm. There are 3 classes there: “Program.cs”, “Filter.cs” and “Calculus.cs”. The simplest is the first one – it launches and manages the process by creating other classes objects and calling functions from them.
“Calculus” is a “support” class. It is used to make the necessary calculations: average, deviation, normal distribution.
The most important class is “Filter”. It implements the main algorithm and has two main functions: TrainFilter and Filtration. To train the filter we create the training data set. The example shows how a set of data related to height, length and width of the vehicle.
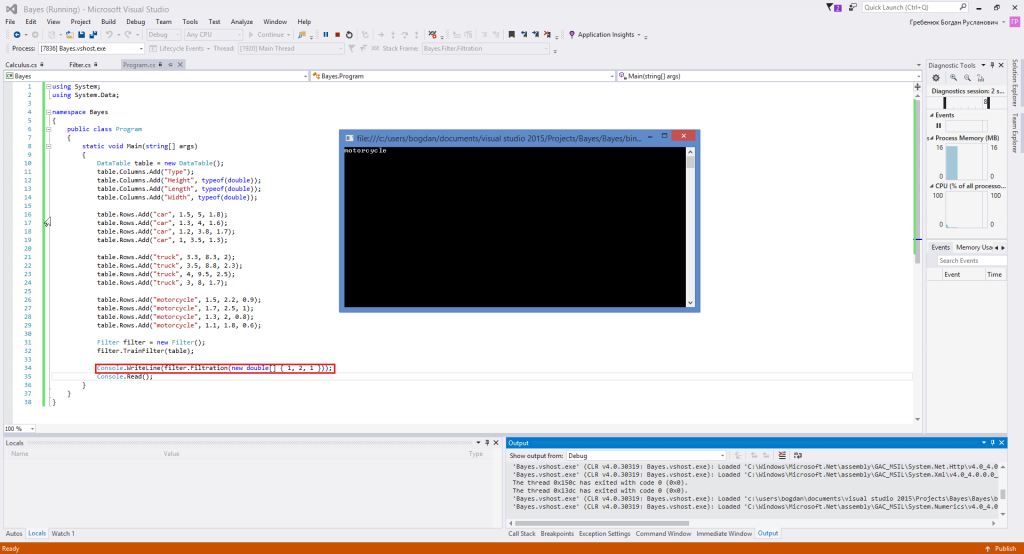
Here are the screenshots of how the program works. The parameters marked red relate to height, length and width of the vehicle. Firsts time let’s run it with (1,2,1)
As we see, when parameters are close to the values that relate to motorcycles, the program lets us know about it.
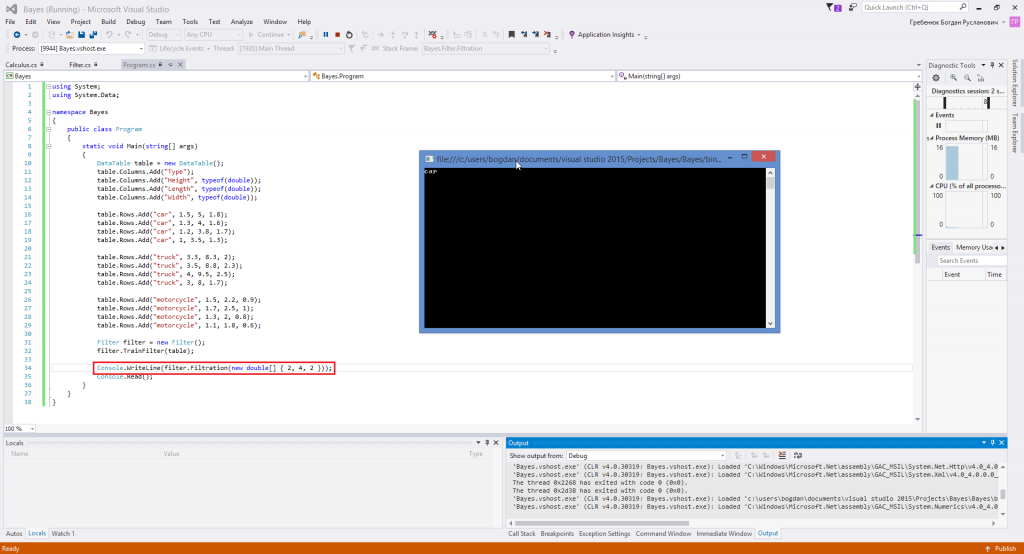
Now let’s try (2,4,2)
Now we see the “car” message.
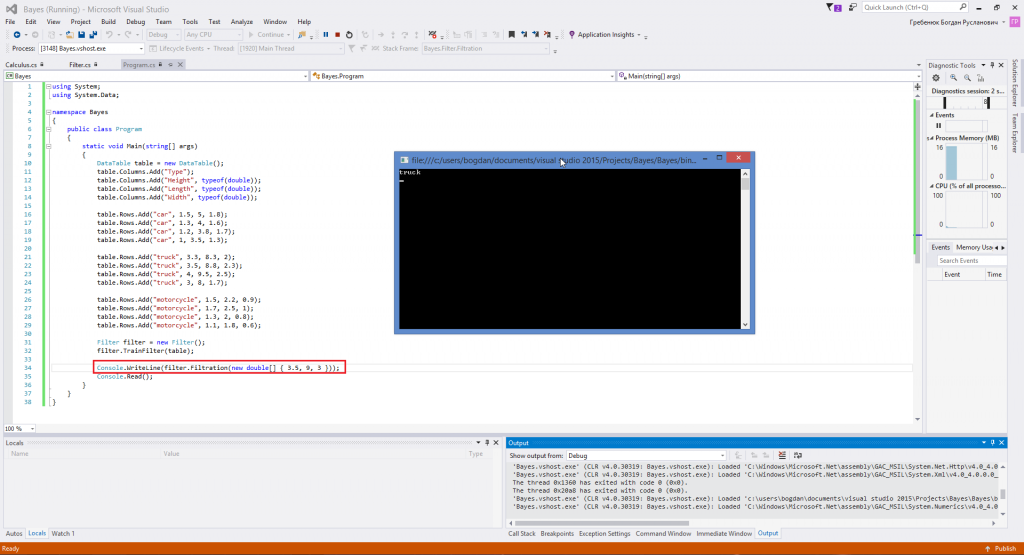
And now let’s input the values that are closest to the truck dimensions:
We can see that it outputs “truck”. So that’s how it’s done. Thank you for the attention.
Source code of the mentioned classes:
Program.cs:
[code language=”cpp”]
using System;
using System.Data;
namespace Bayes
{
public class Program
{
static void Main(string[] args)
{
DataTable table = new DataTable();
table.Columns.Add("Type");
table.Columns.Add("Height", typeof(double));
table.Columns.Add("Length", typeof(double));
table.Columns.Add("Width", typeof(double));
table.Rows.Add("car", 1.5, 5, 1.8);
table.Rows.Add("car", 1.3, 4, 1.6);
table.Rows.Add("car", 1.2, 3.8, 1.7);
table.Rows.Add("car", 1, 3.5, 1.3);
table.Rows.Add("truck", 3.3, 8.3, 2);
table.Rows.Add("truck", 3.5, 8.8, 2.3);
table.Rows.Add("truck", 4, 9.5, 2.5);
table.Rows.Add("truck", 3, 8, 1.7);
table.Rows.Add("motorcycle", 1.5, 2.2, 0.9);
table.Rows.Add("motorcycle", 1.7, 2.5, 1);
table.Rows.Add("motorcycle", 1.3, 2, 0.8);
table.Rows.Add("motorcycle", 1.1, 1.8, 0.6);
Filter filter = new Filter();
filter.TrainFilter(table);
Console.WriteLine(filter.Filtration(new double[] { 3.5, 9, 3 }));
Console.Read();
}
}
}
[/code]
Calculus.cs:
[code language=”cpp”]
using System;
using System.Collections.Generic;
using System.Linq;
namespace Bayes
{
public static class Calculus
{
public static double Deviation(this IEnumerable<double> origin)
{
double average = origin.Average();
double v = origin.Aggregate(0.0, (overall, next) => overall += Math.Pow(next – average, 2));
return v / (origin.Count() – 1);
}
public static double Average(this IEnumerable<double> origin)
{
if (origin.Count() < 1)
return 0.0;
double size = origin.Count();
double total = origin.Sum();
return total / size;
}
public static double NormalDistrubution(double val, double average, double stdDev)
{
double a = stdDev * Math.Sqrt(2.0 * Math.PI);
double b = (val – average) * (val – average) / (2.0 * stdDev * stdDev);
return Math.Exp(-b) / a;
}
public static double NormDist(double val, double average, double stdDev, bool aggregate)
{
const double p = 50000.0;
double lowerBorder = 0.0;
if (aggregate)
{
double amplitude = (val – lowerBorder) / (p – 1.0);
double integral = 0.0;
for (int i = 1; i < p – 1; i++)
{
integral += 0.5 * amplitude * (NormalDistrubution(lowerBorder + amplitude * i, average, stdDev) +
(NormalDistrubution(lowerBorder + amplitude * (i + 1), average, stdDev)));
}
return integral;
}
else
{
return NormalDistrubution(val, average, stdDev);
}
}
}
}
[/code]
Filter.cs:
[code language=”cpp”]
using System;
using System.Collections.Generic;
using System.Linq;
using System.Text;
using System.Data;
namespace Bayes
{
public class Filter
{
private DataSet info = new DataSet();
public DataSet DataSet
{
get { return info; }
set { info = value; }
}
public IEnumerable<double> SelectLines(DataTable chart, int column, string keyWord)
{
List<double> list = new List<double>();
DataRow[] rows = chart.Select(keyWord);
for (int i = 0; i < rows.Length; i++)
{
list.Add((double)rows[i][column]);
}
return list;
}
public string Filtration(double[] obj)
{
Dictionary<string, double> result = new Dictionary<string, double>();
var outcome = (from line in info.Tables[0].AsEnumerable()
group line by line.Field<string>(info.Tables[0].Columns[0].ColumnName) into x
select new { key = x.Key, Count = x.Count() }).ToList();
for (int i = 0; i < outcome.Count; i++)
{
List<double> tempResult = new List<double>();
int u = 1, y = 1;
for (int a = 1; a < info.Tables["Normal distribution"].Columns.Count; a = a + 2)
{
double average = Convert.ToDouble(info.Tables["Normal distribution"].Rows[i][u]);
double deviation = Convert.ToDouble(info.Tables["Normal distribution"].Rows[i][++u]);
double counting = Calculus.NormalDistrubution(obj[y – 1], average, Math.Sqrt(deviation));
tempResult.Add(counting);
u++; y++;
}
double ultimateResult = 0;
for (int b = 0; b < tempResult.Count; b++) { if (ultimateResult == 0) { ultimateResult = tempResult[b]; continue; } ultimateResult = ultimateResult * tempResult[b]; } result.Add(outcome[i].key, ultimateResult * 0.5); } double max = result.Max(v => v.Value);
var name = (from v in result
where v.Value == max
select v.Key).First();
return name;
}
public void TrainFilter(DataTable chart)
{
info.Tables.Add(chart);
//chart
DataTable NormalDist = info.Tables.Add("Normal distribution");
NormalDist.Columns.Add(chart.Columns[0].ColumnName);
//columns
for (int i = 1; i < chart.Columns.Count; i++)
{
NormalDist.Columns.Add(chart.Columns[i].ColumnName + "Average");
NormalDist.Columns.Add(chart.Columns[i].ColumnName + "Deviation");
}
//calc data
var outcome = (from line in chart.AsEnumerable()
group line by line.Field<string>(chart.Columns[0].ColumnName) into x
select new { key = x.Key, Count = x.Count() }).ToList();
for (int j = 0; j < outcome.Count; j++)
{
DataRow dataRow = NormalDist.Rows.Add();
dataRow[0] = outcome[j].key;
int u = 1;
for (int i = 1; i < chart.Columns.Count; i++)
{
dataRow[u] = Calculus.Average(SelectLines(chart, i, string.Format("{0} = ‘{1}’", chart.Columns[0].ColumnName, outcome[j].key)));
dataRow[++u] = Calculus.Deviation(SelectLines(chart, i, string.Format("{0} = ‘{1}’", chart.Columns[0].ColumnName, outcome[j].key)));
u++;
}
}
}
}
}
[/code]
This Naive Bayes spam filter example is provided for reading purpose only. You neither can claim it as your own nor use it in any other ways that violate the author’s rights. We know that learning can be hard, especially if you are trying to master programming, and we are always ready to help with assignments. You can read further and find some other examples and useful articles at our blog, for example, sample of assignment on MATLAB, or free accounting homework help, or place an order and receive your personal Naive Bayes spam filter example to work with. Quality and on-time delivery are guaranteed. Student life becomes much easier with AssignmentShark.


